A Record-Breaking Year for ADA Digital Accessibility Lawsuits

By Jason Taylor on Dec 21, 2020
Topics: ADA Lawsuits

0 Comments
Get a look at the total number of lawsuits from the previous month with the first ADA lawsuit tracker.
 
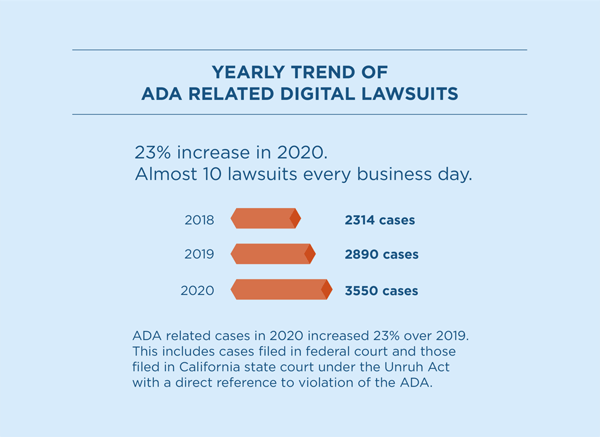
 In 2020, web, app and video accessibility cases are up almost 25% year-on-year. December saw an almost 100% rise over January. 
 
Total digital accessibility lawsuits in 2020 exceeds 3,500. When you combine federal and state ADA lawsuits, the trend is moving upward.


Image Description: Horizontal bar graph shows an increase in digital accessibility lawsuits from 2018 to 2020. At the top of the graph is 2018 with 2,314 cases, below 2018 is 2019 with 2,890 cases, and last is 2020 with 3,3550 cases. Above the graph it says “23% increase in 2020. Almost 10 lawsuits every business day.”   Text reads: ADA related cases in 2020 increased by 23% over 2019. This includes cases filed in federal court and those filed in California state court under the Unruh Act with a direct reference to violation of the ADA.

Accessibility Cases citing the ADA Accelerate

→ Assess Your Site’s Accessibility

Plaintiffs keep finding websites with lots of accessibility issues. (A 2020 WebAIM research report found that 98.1% of the top 1,000,000 websites’ home pages had detectable WCAG failures). 

It is becoming easier for plaintiff firms to document issues and build their claim. It is fast and easy to visit a digital store, food delivery or financial service offering.

Companies are adding stores, websites and digital content at a rapid pace. Unfortunately, companies accessibility initiatives are not keeping up. 

Plaintiff firms are getting more efficient when building and filing claims. Claims are rising at the federal and state level, especially in California with more filings under The Unruh Civil Right Act. 
 

COVID Lockdown provided Short Pause

Image Description: Bar graph shows how COVID-19 influenced the number of lawsuits filed in 2020. The graph begins with January having 284. February has 267. March has 228. April has 129. May has 189. June has 231. July has 330. August has 384. September has 356. October has 33. November has 332. Finally, December has 487. There is a trend line that increaseses through the months.   Text reads: The lockdown in states such as New York affected filing numbers during the initial lockdown period. After July, plaintiffs increased the rate of filing. By the end of 2020, lawsuits increased by over 50% above the pre-pandemic rate of filing.

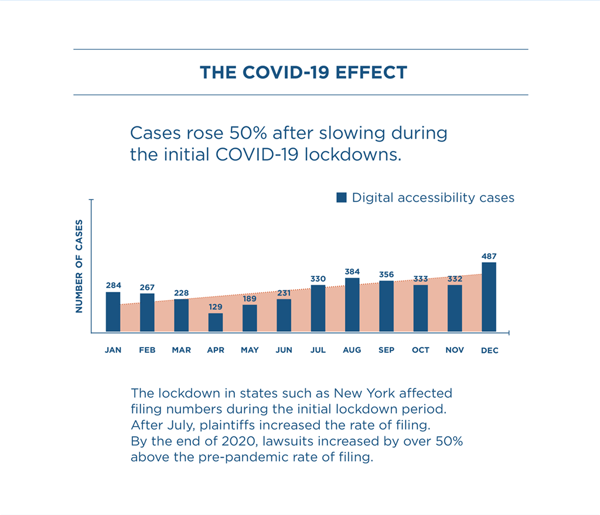
The lockdown in New York during April and May made a dent in the monthly filing numbers. But, after June, the lawsuits have come roaring back.
 
December will see a 100% rise over January. 
 

Good Web Accessibility lacking in Retail Image Description: Pie chart that depicts the industries that had the most lawsuits. The largest piece of the pie chart is Retail with 77.55%, followed by Other with 14.68% and Food Service with 7.77%. Beneath the pie chart is each industry and that industry's corresponding percentage rates. At the top of the list is Retail with 77.55%, followed by Food Service with 7.77%. Other has 3.38%. Education has 2.45%. Entertainment & Leisure has 1.44%. Banking/Financial has 1.38%. Insurance holds 1.32%. Healthcare makes up 1.21%. Travel/Hospitality accounts for 1.04%. Automotive makes up 0.99%. Digital Media & Agencies have 0.68%. Fitness & Wellness has 0.39%. Real Estate Agencies & Properties holds. with 0.31%. Telecommunications has 0.08%. of lawsuits. Above the chart is a statement reads, “Retailers were cited the most in digital accessibility lawsuits. Food Service surpassed Entertainment and Leisure year over year. Education made the top 5 for the first time.”   Text reads: Retail continued to be the number one targeted industry with almost 2000 retailers being sued in 2020. The Food Service Industry moved up to the number two spot in 2020 adding to an already tough year due to COVID-19 restrictions.

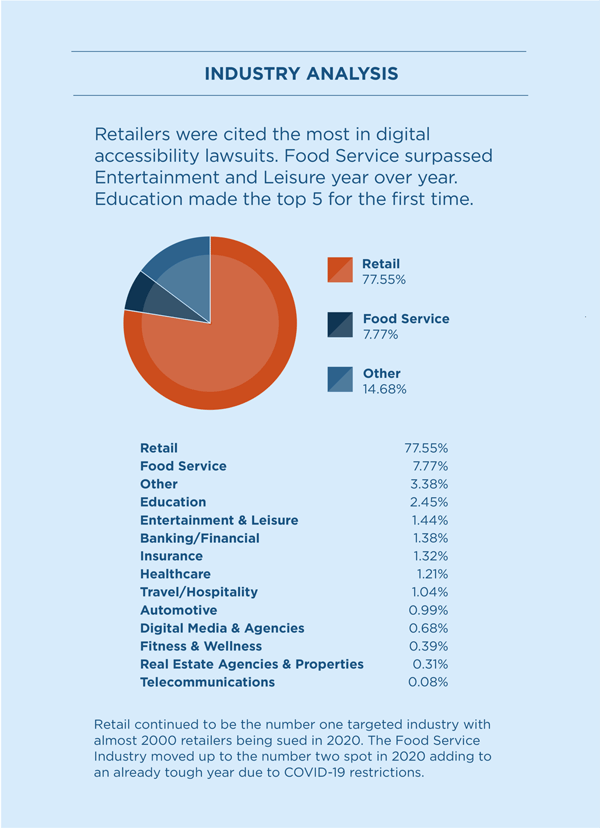
Retail was the main industry for digital accessibility lawsuits in 2020, with over 70% of cases.
 
In 2020, thousands or retailers have websites and apps. Those websites are complicated. For retailers, Web and app content changes happen often. At the same time, web teams have limited resources. 
 

Fix web accessibility fast or get sued again

Image Description: The design includes a shopping bag, webpage, t-shirt, and smartphone overlapping each other. Below the design the image reads “over 20% of lawsuits in 2020 were filed against a company that had already been sued at least once in the past two years.” Below the statement are two pie charts, one for 2020 and the other for 2019. Each of them includes the total number of companies sued in the respected year. It also include how many of them were sued more than once. In 2020, 3,550 companies were sued and 651 were sued multiple times. In 2019, 2,890 companies were sued and 496 were sued multiple times.   Text reads: Companies and brands are receiving multiple ADA related lawsuits. Sometimes the first is for a website and then for a mobile app. Other times the second is for an extra brand website, or in some cases the same website is targeted again by a different plaintiff. In short, if you are not accessible you are not safe from another lawsuit.

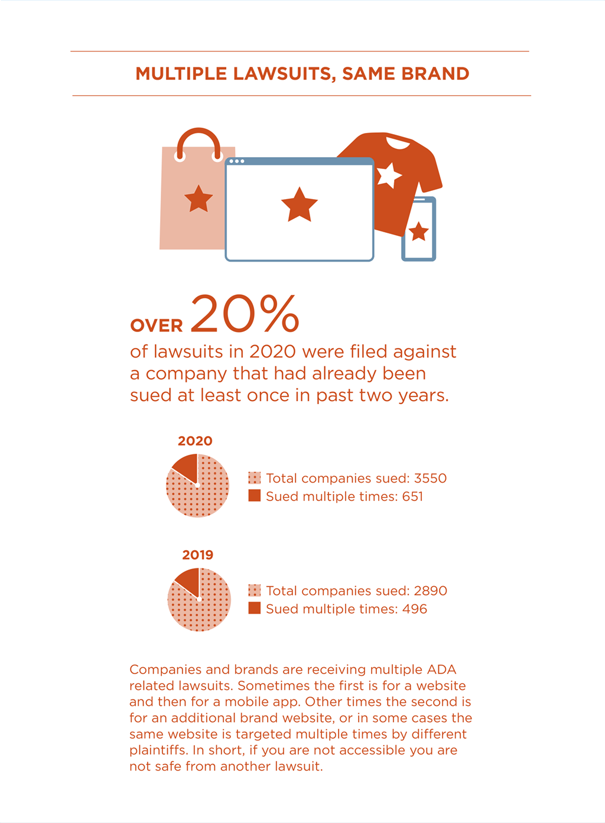
Another trend that continued, companies get more lawsuits if issues are ignored. There is a one in five chance that a company will receive a second lawsuit within 12 months of the first.
 
Lawsuits can be for the same website or for another digital experience, such as an app.
 

New York and California have the most Web  accessibility lawsuits

Image Description: Map that shows the states with the most cases in the US. Each of the major states has a dot that varies in size. The dots go by a scale reference of 200 cases. Below the map is a list of the states from most to least cases. The list begins with New York with 1,756 cases, or 49.46% of the total. Following is California with 989 cases or 27.86%. Florida has 542 cases or 15.27%. Pennsylvania has 187 cases or 5.27%, Illinois has 32 cases or 0.90%. Massachusetts has 25 cases or 0.70%, Connecticut has 12 cases or 0.34%. Finally, Indiana has 7 cases or 0.20%.   Text reads: The top three states make up over 90% of cases. The filing state does not represent where defendants live. A company can receive lawsuits in any state where that company does business.

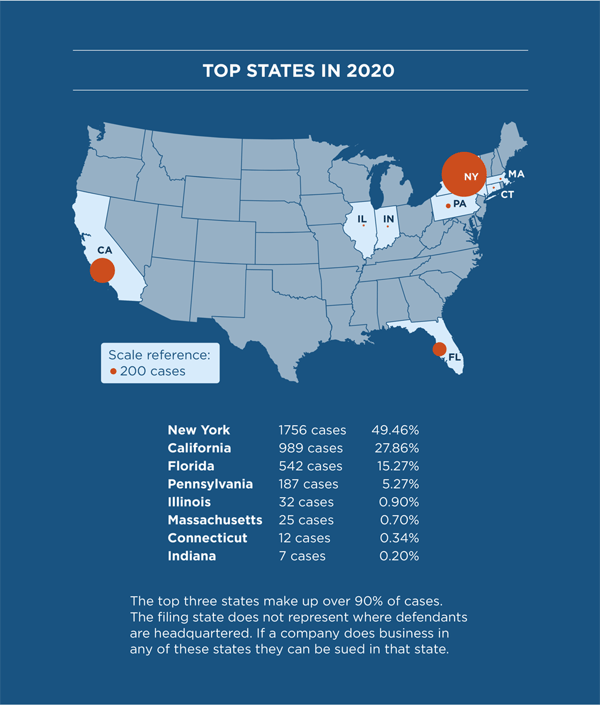
New York and California are the top states for digital accessibility lawsuits. Both states allow plaintiffs to sue in federal or state court. These state courts favor plaintiffs.
 
Remember, plaintiffs can sue a company in any state where that company conducts business.
 

ADA lawsuits cover more than web accessibility

Tile 8: Digital Targets Expanding Image Description: Design features a smartphone, tablet, computer monitor, and television. Above the design, a statement reads, "Lawsuits in 2020 reflect the importance of considering accessibility for all digital channels and content”. Below the design is a chart that lists the digital channels that have the most claims in order from most to least. At the top of the chart is desktop websites with 3,235 claims. Mobile apps has 296 claims. There were 150 claims related to video accessibility. Combined web & app related lawsuits received 16 claims. There were three claims based on inaccessible mobile websites.   Text reads: Desktop Websites dominate the overall number of lawsuit claims. Mobile Apps continue receive attention. Video content also recived claims of ADA violations. Video lawsuits request that all videos have closed caption and audio descriptions.  

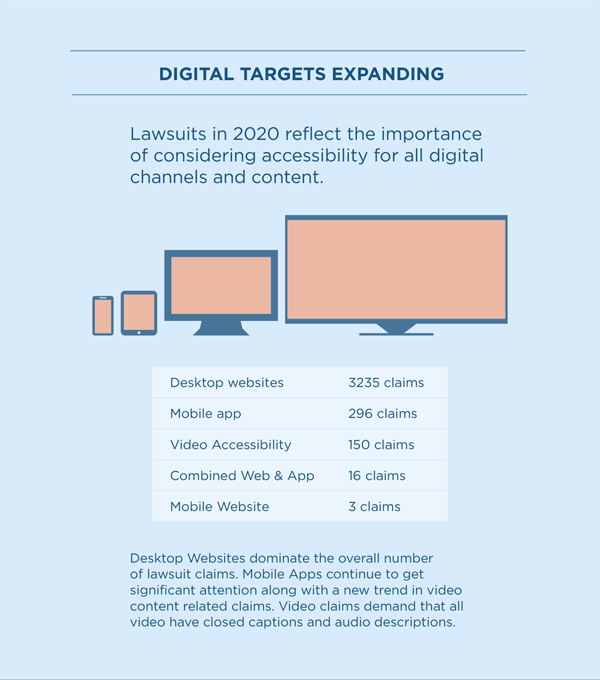
The type of digital experiences listed in ADA claims are starting to get broader. Video accessibility appeared in accessibility lawsuits more often in 2020. It's easy to argue that missing closed captions or audio descriptions violate the ADA.
 
The Unruh Act provides $4,000 for each violation, so using video is a simple and direct way to make a case.
 

Widgets and overlays fail to protect companies 

Tile 9: Widgets and Overlays Offer No Guarantees  Image Description: Webpage design reads “Lawsuits filed against companies using overlays or widgets for accessibility reach one-a-day by end of 2020.” Bar chart shows the number of lawsuits against companies with widgets and overlays from July through December 2020. July had 18 cases, August had 27, September had 25, October had 32, November had 29, and December had 47.   Text reads: More than 250 lawsuits were filed in 2020 against companies using widgets or overlays as an accessibility solution for their websites. The last 6 months of 2020 shows a significant increase in cases filed with the rate eclipsing more than one a day.

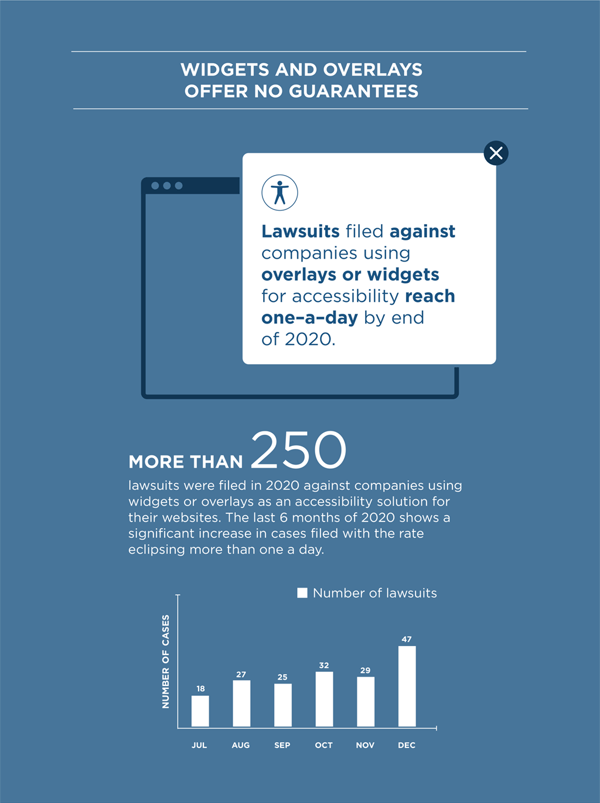
More than 200 cases were against companies that used accessibility widgets or overlays. These solutions do nothing to make a website more accessible for the blind.

 
Because issues are not resolved and code is not fixed, plaintiff "testers" find violations. Widget and overlay vendors didn't protect companies from ADA lawsuits.
 

A Small Group of plaintiff Law Firms file most ADA Web Accessibility Lawsuits

mage Description: Above the image a statement reads “70% of all cases are brought by only 10 Plaintiff Law Firms.” Below is a table that compares defendant lawyers, on the left, to plaintiff lawyers, on the right. Beneath the term defendant lawyers there is a quote. It reads, “We will defend you, but you should be accessible. ” Under the plaintiff lawyer side of the chart it reads “We will sue you if you do not provide an accessible website.” The table then compares the top ten defendant lawyers to plaintiff lawyers from one to ten. Starting at number one on the left for defendant lawyers is Dentons US LLP with 81 cases. Following are Jackson Lewis P.C. with 67 cases. Ogletree, Deakins, Nash, Smoak & Stewart P.C. had 60 cases. Morgan, Lewis, Bockius LLP has 48. Lewis Brisbois Bisgaard & Smith LLP has 41 cases. Seyfarth Shaw LLP has 30. O’Hagan Meyer LLC has 27. Sheppard, Mullin, Richter & Hampton LLP has 26. Littler Mendelson P.C. has 26. Kaufman Dolowich & Voluck, LLP has 17. Number one on the right for plaintiff lawyers is Pacific Trial Attorneys with 395 cases. Following are Stein Saks, PLLC with 371 cases, Cohen & Mizrahi LLP with 286. Jeffrey A. Gottlieb, ESQ. has 238. Chunningam Law PLLC has 222. Mars Khaimov Law, PLLC has 189. Beverly Hills Trial Attorneys P.C. has 173. Shaked Law Group, P.C. has 148. Wilshire Law Firm has 148. Nye, Stirling, Hale & Miller, LLP has 108. Beneath the table, two columns compare the total of the defendant lawyers, on the left, to the total number of the plaintiff lawyers, on the right. The column on the left reads 423 cases and the column on the right reads 2,278.   Text reads: More than 1,000 different lawyers across hundreds of law firms work as defense for active ADA-based web and app accessibility cases. Only a small group of law firms represent the majority of plaintiffs.  

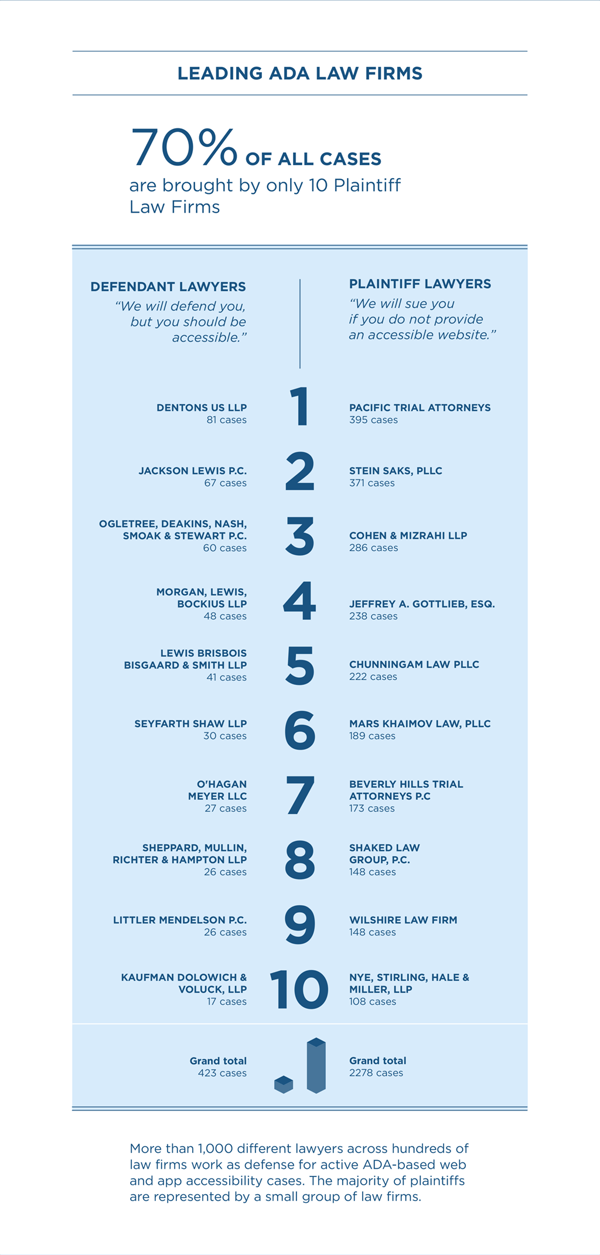
The top ten plaintiff firms represent 70% of lawsuits, that’s over 2,500 cases across only ten law firms. Plaintiff firms specialize in ADA cases and represent only a few plaintiffs.
 
The defense side is more dispersed across over 1,000 different lawyers. The top ten law firms for defense represent about 20% of lawsuits. 
 

More Digital Accessibility Lawsuits add to a tough year 

The number of lawsuit, industries effected and digital experiences targeted rose in 2020. Fear or lawsuits adds extra costs and concerns for businesses already facing a tough year due to lockdowns. 
 
Companies can get proactive by integrating accessibility into their development cycle. This will create more inclusive web experience for all.
 

Download our full 2020 Digital Accessibility report.


Note on Methodology

The UsableNet team monitors all ADA lawsuits filed at the federal and state level. This includes cases filed in California under the Unruh Civil Rights Act. (Unruh Act).

The research team reviews if lawsuit claims are for digital accessibility or physical. (The ADA still generates over 10,000 cases filed for physical violations each year).
 
The UsableNet team separates out any lawsuits related to digital accessibility. This means violations of the ADA based on content like websites, mobile apps or video.
 
The team logs any ADA lawsuits based on the digital accessibility. At year-end, we report on the top trends from the past several months. Our web accessibility report also looks at how the most recent year compares to past trends.
 
 
Need to improve digital usability, accessibility or performance? We can help.
Partner with us. Get in touch.