Each year, we review every ADA lawsuit we can find. Not summaries or press releases, but the actual complaints filed in federal and key state courts.
From that dataset, we isolate lawsuits targeting digital properties—such as websites, mobile apps, and online services—and analyze recurring patterns: where cases are filed, which companies are sued repeatedly, which industries dominate, and how plaintiff strategies evolve.
By the end of 2025, more than 5,000 digital accessibility lawsuits had been filed. Read at scale, those filings tell a consistent, data-driven story—one that matters for any business that relies on digital channels.
This is not legal advice. It is what the lawsuits themselves show.
Download the full 2025 ADA Web Lawsuit Report
This article highlights key patterns, but the full report includes detailed charts, state-by-state breakdowns, industry analysis, and methodology based on thousands of filings reviewed by the UsableNet research team.
ADA Web Lawsuit Risk Is Concentrated in Certain States
Geography remains one of the strongest predictors of exposure, even for businesses with no physical locations.
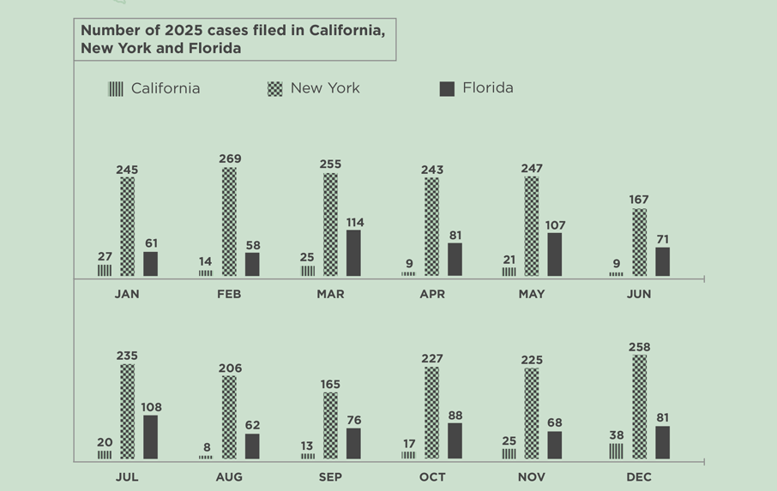
In 2025, New York accounted for well over one-third of all state-level ADA website lawsuits. Nearly 2,000 cases were filed in New York and California state courts combined. Federal filings added another 3,100-plus cases, many tied to user activity originating in New York.
Florida reemerged as a high-volume jurisdiction, with monthly filings frequently exceeding 80 to 110 cases. California remained consistently active despite lower totals than prior years. At the same time, filings increased in Pennsylvania, Minnesota, and Missouri—states that previously saw limited activity.
The complaints make one point clear: a physical presence is not required. If users in these states can access your website, courts are allowing cases to proceed.
Repeat ADA Lawsuits Are Now Common

A prior lawsuit significantly increases future risk.
Of the more than 5,000 digital accessibility lawsuits filed in 2025, 1,427 targeted companies that had already faced an ADA web accessibility claim. In federal court alone, 46 percent of cases involved repeat defendants.
The complaints follow a familiar pattern: a settlement, limited remediation, a new plaintiff, and another filing—often within months. Plaintiff firms track litigation history and revisit companies that appear to have addressed only surface-level issues.
The data shows that one lawsuit materially increases the likelihood of another unless remediation is comprehensive.
The report breaks down how often companies are sued again, how quickly repeat filings occur, and where prior remediation efforts fall short.
[Get the full ADA lawsuit report →]
Most ADA Website Lawsuits Target a Few Key Industries
Industry concentration remains consistent year over year.
In 2025:
-
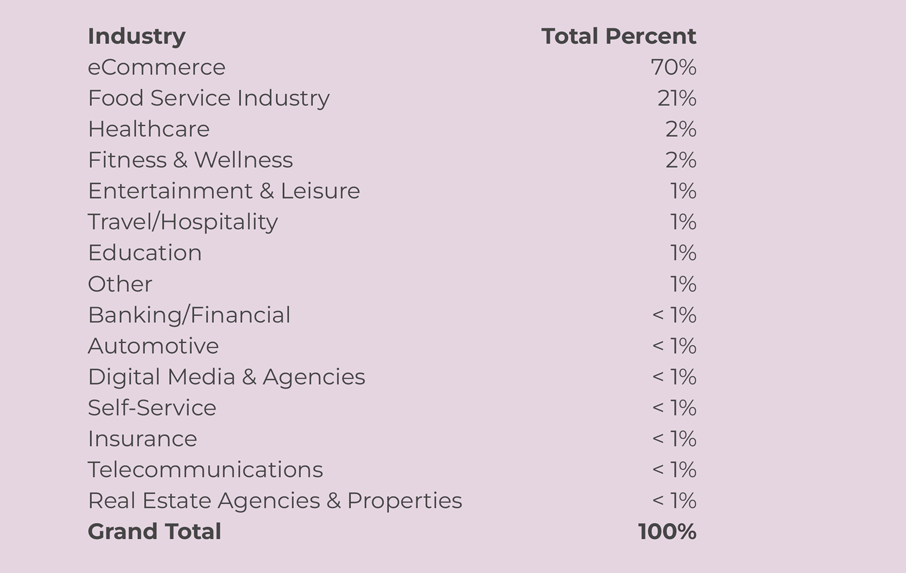
E-commerce accounted for nearly 70 percent of all ADA web lawsuits.
-
Food and service businesses made up roughly 21 percent.
-
Healthcare represented approximately 2 to 3 percent
All other sectors—education, travel, entertainment, and financial services—accounted for a comparatively small share.
These industries share a common complaint. Their websites are the primary way customers access essential services. When core workflows such as purchasing, ordering, booking, or refilling prescriptions are inaccessible, litigation follows quickly.
If your website is how customers transact, risk is inherently higher.
Large Retailers Face Disproportionate ADA Lawsuit Exposure
Company size amplifies risk.
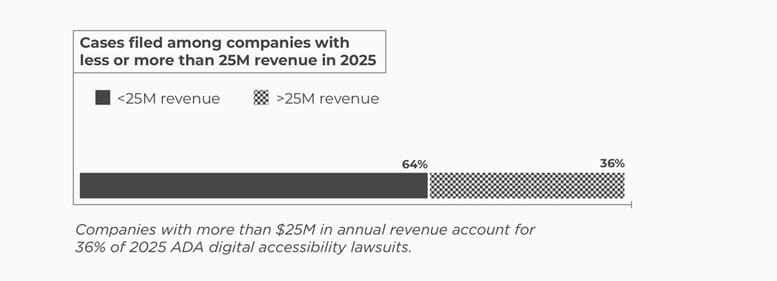
In 2025, 36 percent of companies sued reported annual revenue exceeding $25 million, continuing an upward trend from prior years. Among the top 500 e-commerce retailers, 35.8 percent received at least one ADA accessibility lawsuit.

The complaints frequently cite brand recognition, frequent use, and intent to return—factors that are easier to establish with large retailers.
High traffic increases exposure. Visibility simplifies standing. Larger enterprises are also perceived as capable of funding remediation.
ADA Web Litigation Is Driven by a Sophisticated Plaintiff Bar
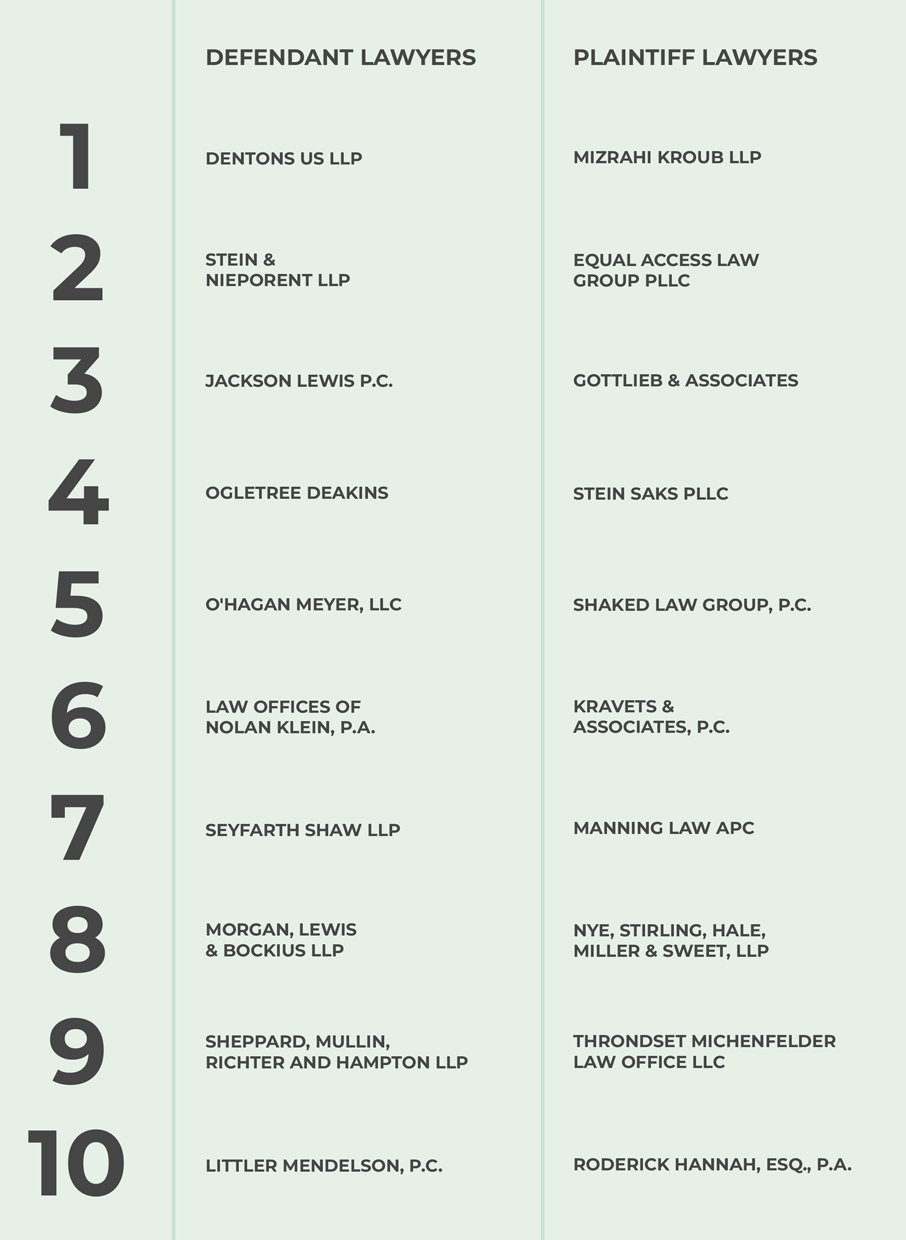
A small number of plaintiff firms account for the majority of 2025 filings.
These firms file at scale across federal and state courts. Their complaints are standardized, reference accessibility standards fluently, and adapt quickly to jurisdiction-specific requirements.
As state court filings continue to expand, particularly in New York, the coordinated nature of this litigation becomes more apparent. This is not reactive enforcement. It is systematic, deliberate, and refined year over year.
Digital accessibility litigation now functions as a repeatable legal model.
Accessibility Widgets Do Not Prevent ADA Website Lawsuits
Widgets appear frequently in complaints—but not as protection.
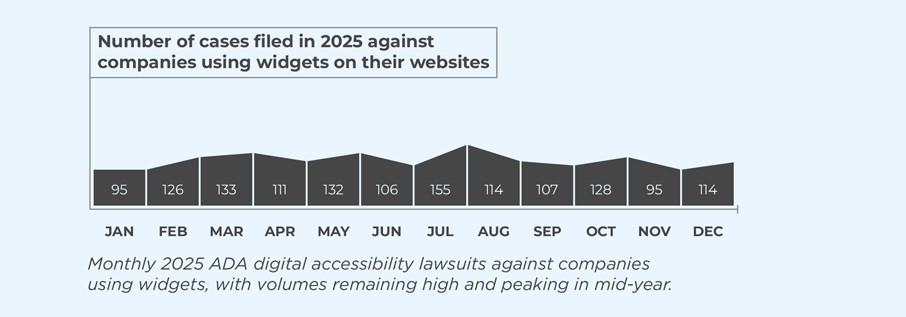
In 2025, an increasing number of lawsuits explicitly referenced accessibility widgets while alleging unresolved code-level barriers. Some filings also claim that widgets interfere with screen readers or introduce additional obstacles.
Monthly filing data shows no meaningful reduction in lawsuits against widget users. Lawsuit volume remained steady throughout the year, peaking above 150 cases in a single month.
The conclusion from the filings is consistent: widgets do not materially reduce legal risk. Courts and plaintiffs continue to expect substantive remediation.
Key Takeaway for 2026 Planning
When you review thousands of lawsuits rather than isolated examples, patterns become predictable.
The same industries.
The same companies are returning.
The same mistakes are repeated.
As organizations plan for 2026, the message from 2025 ADA web lawsuits is clear: digital accessibility risk is predictable, repeatable, and driven by identifiable factors—and organizations that fail to address them fully will continue to face litigation.
Plan for 2026 with the complete lawsuit data
The complete report provides the context, data, and trend analysis needed to assess risk and prioritize accessibility improvements with confidence.