Midyear Report - App & Web Accessibility Lawsuits on track for record

By Jason Taylor on Jul 1, 2021
Topics: ADA Lawsuits

0 Comments

Our bi-annual report is out and below are the highlighted trends we are seeing along with some color behind the numbers. 

The full report is free. Download here.

The report data, images, and information can be shared freely but please remember to reference UsableNet as source and link to UsableNet.com

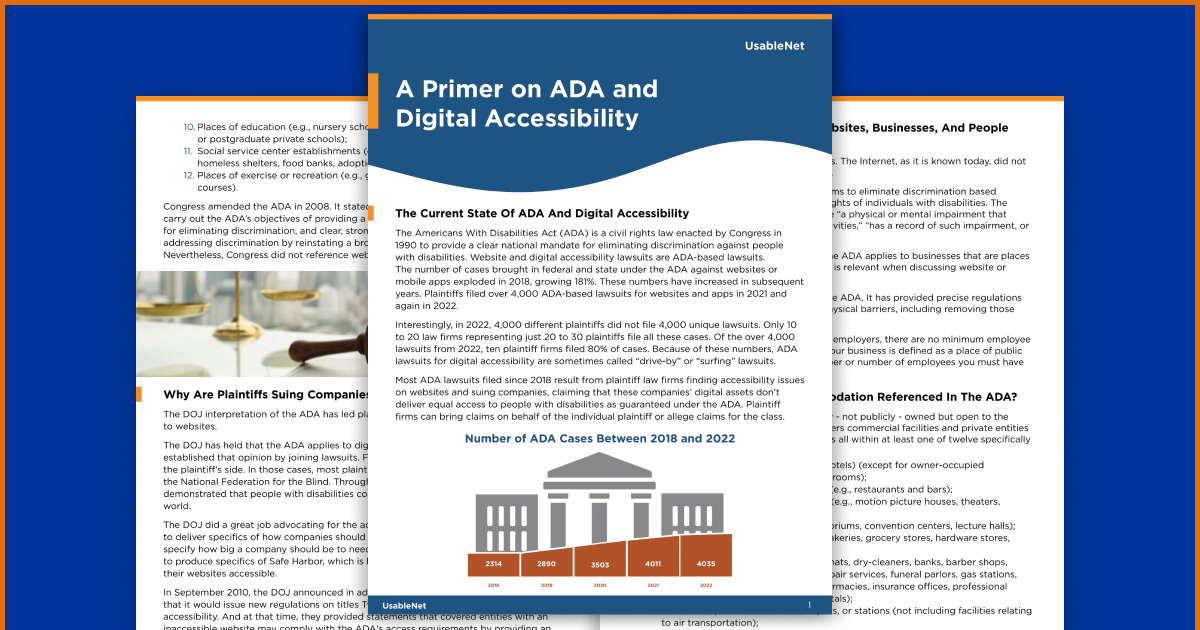
The report includes the full methodology behind the numbers. In short, we track federal and state ADA-related lawsuits. We download and read all ADA (physical and digital) dockets. The UsableNet Data Team separates out lawsuits that are brought against a website, app, or video. These digital-related lawsuits are tracked and become the source of our data. 

So on to the highlights.

A Big Year Ahead 

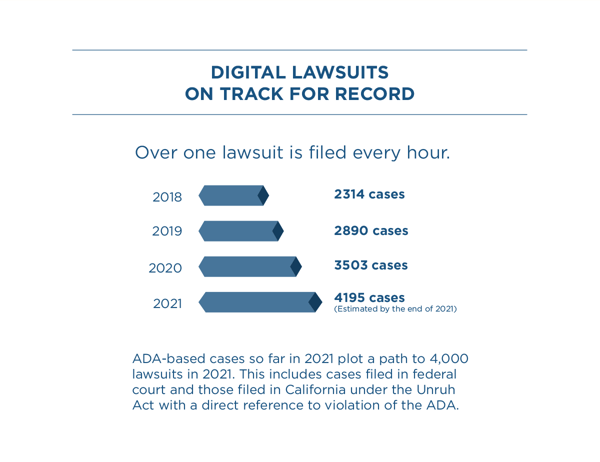
The number of lawsuits that claim a website, app, or video is in-accessible has increased 20% year over year. Based on midyear trends, 2021 may total more than 4,000 lawsuits. We are seeing new plaintiff law firms filing suits and broader claims being made, such as video inaccessibility.

: Over one lawsuit is filed every hour. 2018 had 2314 cases; 2019 had 2890 cases; 2020 had 3503 cases, and 2021 will have 4195 cases by the end, according to estimates based on the midyear filing rate. The text reads ADA-based cases so far in 2021 plot a path to 4,000 lawsuits in 2021. This includes cases filed in federal court and those filed in California under the Unruh Act with a direct reference to violation of the ADA. 

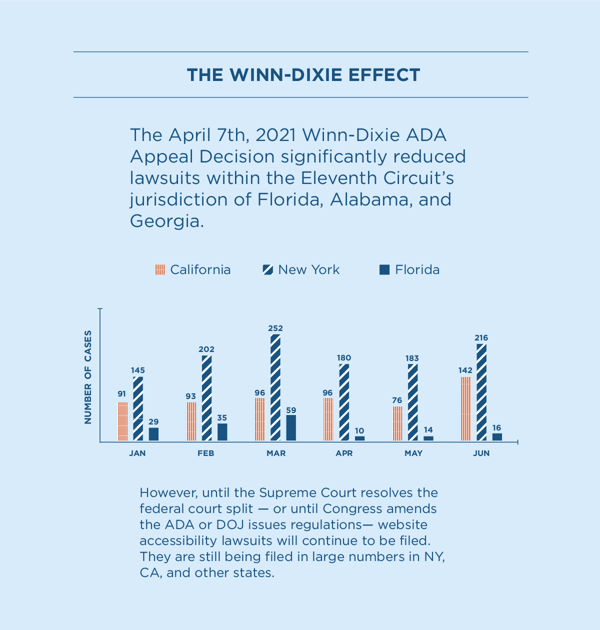
Winn-Dixie makes a small dent  

The recent Winn-Dixie case decision in Florida has reduced the number of cases filed in the 11th circuit since March. Yet, lawsuits continue in large numbers in New York and California. We expect California lawsuits to increase after the latest development in the Domino’s case. 

Jan had 91 cases filed in California, 145 in New York and 29 in Florida. Feb had 202 in California; 93 in New York and 35 cases filed in Florida. March had 252 cases in California, 59 in New York, and 96 in Florida.  April had 96 cases in California, 180 in New York, and 10 in Florida. May had 14 cases in New York, 16 in California and 76 in Florida. June had 142 cases in California, 216 in New York, and 16 cases in Florida. The text reads: The April 7th, 2021 Winn-Dixie ADA Appeal Decision significantly reduced lawsuits within the Eleventh Circuit’s jurisdiction of Florida, Alabama, and Georgia. However, until the Supreme Court resolves the federal court split — or until Congress amends the ADA or DOJ issues regulations— website accessibility lawsuits will continue to be filed. They are still being filed in large numbers in NY, CA, and other states.

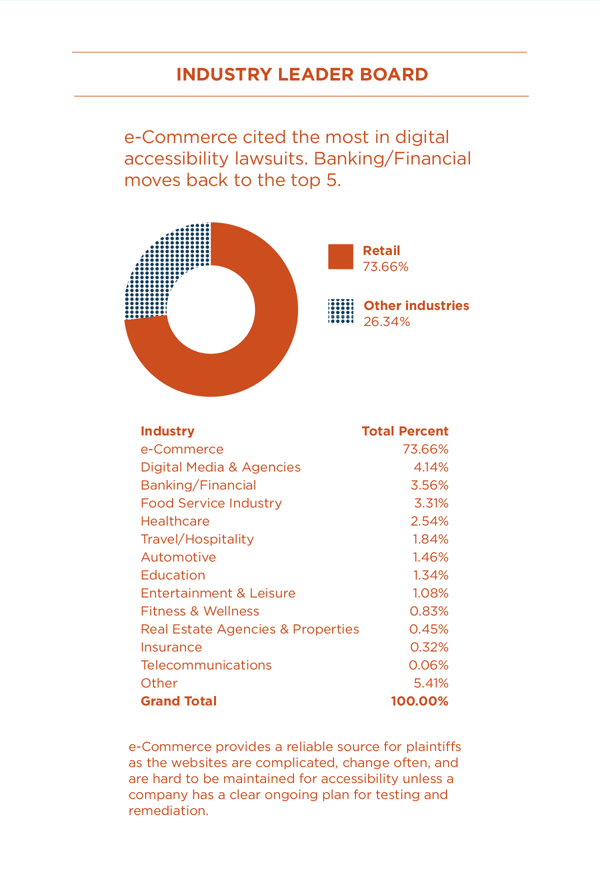
E-Commerce is the main target, not just retail  

E-commerce received by far the biggest number of lawsuits. it is a broad category that goes beyond traditional retailers. Due to the pandemic, the shift to digital commerce for all businesses has accelerated. 

The text reads: e-Commerce cited the most in digital accessibility lawsuits. Banking/Financial moves back to the top 5.  E-commerce had 73.66% while all other industries totaled 26.34%. Image description: e-Commerce 73.66%; Digital Media & Agencies 4.14%; Banking/Financial 3.56%; Food Service Industry 3.31%; Healthcare 2.54%; Travel/Hospitality 1.84%; Automotive 1.46%; Education 1.34%; Entertainment & Leisure 1.08%; Fitness & Wellness 0.83%; Real Estate Agencies & Properties 0.45%; Insurance 0.32%; Telecommunications 0.06%; and Other 5.41% for a Grand Total of 100.00%.   The text reads: e-Commerce provides a reliable source for plaintiffs as the websites are complicated, change often, and are hard to be maintained for accessibility unless a company has a clear ongoing plan for testing and remediation.

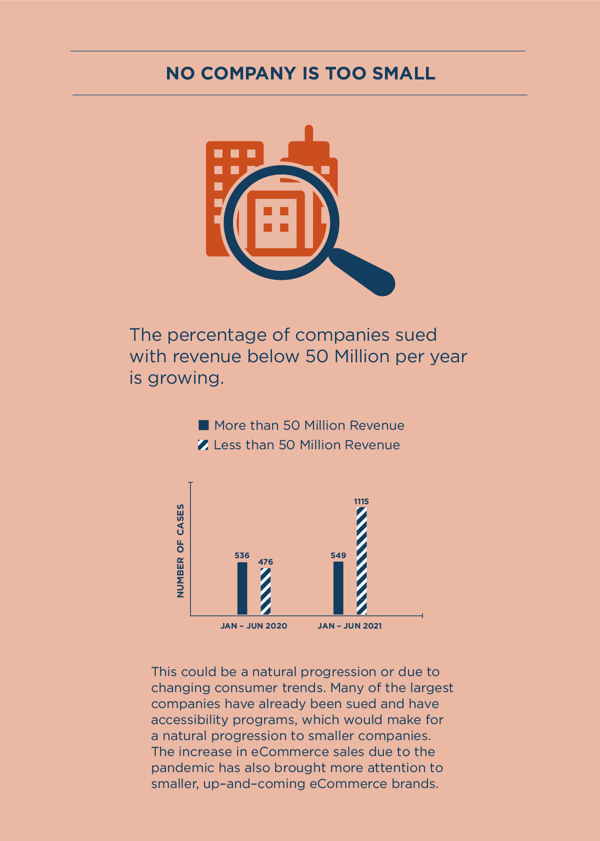
Smaller businesses in the crosshairs  

As the number of lawsuits increases, companies of all sizes are being sued. Companies with revenue of less than 50 million received more lawsuits than their larger counterparts.  

476 cases were filed against companies with less than 50 Million in revenue and 536 cases were filed against companies with more than 50 Million in revenue in Jan – June 2020.  549 cases were filed against companies that had more than 50 Million in revenue and 1,115 cases were filed against companies that had less than 50 Million in Revenue in 2021. The text reads: The percentage of companies sued with revenue below 50 Million per year is growing. This could be a natural progression or due to changing consumer trends. Many of the largest companies have already been sued and have accessibility programs, which would make for a natural progression to smaller companies. The increase in eCommerce sales due to the pandemic has also brought more attention to smaller, up–and–coming eCommerce brands.

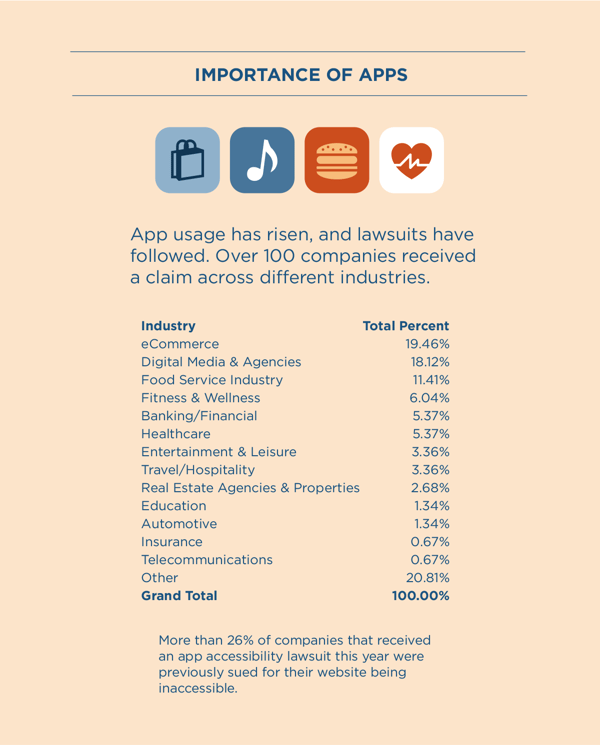
App suits grow across industries  

As mobile use increases, more App-related lawsuits are being filed. Now nearly every industry has had lawsuits related to Apps.  

The text reads: App usage has risen, and lawsuits have followed. Over 100 companies received a claim across different industries.   Image description: Industry Total Percent eCommerce 19.46% Digital Media & Agencies; 18.12% Food Service Industry; 11.41% Fitness & Wellness; 6.04% Banking/Financial; 5.37% Healthcare; 5.37% Entertainment & Leisure; 3.36% Travel/Hospitality; 3.36% Real Estate; Agencies & Properties; 2.68% Education; 1.34% Automotive; 1.34% Insurance; 0.67% Telecommunications; 0.67% and Other 20.81%. For a Grand Total of 100.00%   The text reads More than 26% of companies that received an app accessibility lawsuit this year were previously sued for their website being inaccessible.


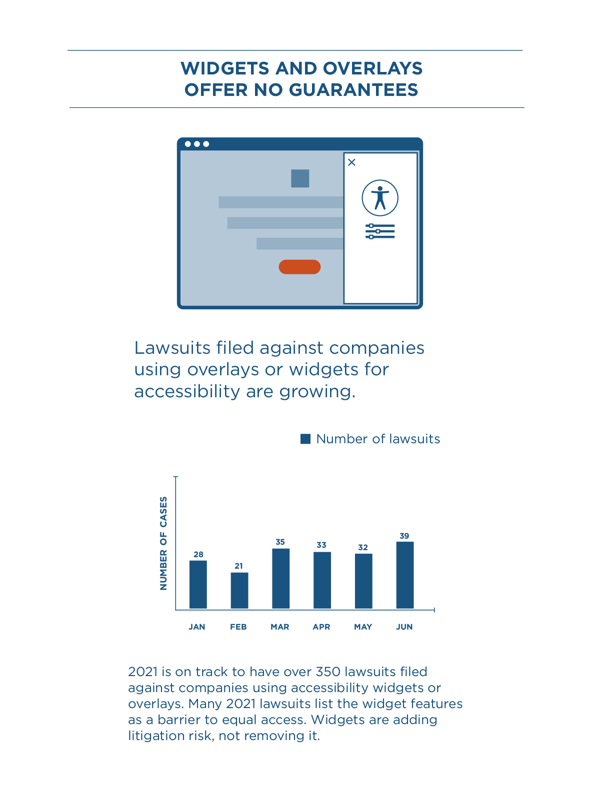
Widgets and overlays add no protection

The number of lawsuits that include a feature of a widget as part of the claim is growing.

The text reads: Lawsuits filed against companies using overlays or widgets for accessibility are growing.   Image Description: Number of lawsuits against companies using widgets by month, Jan had 28; Feb had 21; March had 35; April had 33; May had 32, and June had 39.    The text reads: 2021 is on track to have over 350 lawsuits filed against companies using accessibility widgets or overlays. Many 2021 lawsuits list the widget features as a barrier to equal access. Widgets are adding litigation risk, not removing it.

Predictions for the Year Ahead 

At UsableNet we create these bi-annual reports to helps build awareness and knowledge about digital accessibility across all industries. We use our findings to inform our team ls on how to best support our clients to ensure accessibility while reducing legal risk. 

Download the full report here.

While a lot can be learned from current numbers, much can change over the next six months. 

For Winn-Dixie - the most recent appeal decision is not the final chapter. The plaintiff is already appealing, https://news.bloomberglaw.com/litigation/blind-winn-dixie-customer-further-appeals-website-access-ruling

We've covered the "Domino's Effect" in previous reports. California has a high number of cases.  This is unlikely to change based on the most recent ruling last week, https://www.lflegal.com/2021/06/dominos-june-2021/

We'll continue to watch the numbers. Subscribe to stay updated.

UsableNet also provides regular updates from our legal partners on key cases and litigation trends, and what it means for our clients as well as the disability community. Watch our most recent webinar on the ADA litigation landscape for digital accessibility lawsuits, featuring attorneys from Lewis Brisbois here

A trusted partner can help you improve accessibility and reduce legal risk. Contact UsableNet for a free consultation with an accessibility expert.

Is your website WCAG 2.0 or 2.1 compliant? Test your website with AQA.


Need to improve digital usability, accessibility or performance? We can help.
Partner with us. Get in touch.